Data Logging, Dashboard & Alerts สำหรับ Smart Farm: เก็บข้อมูลอะไรและแสดงอย่างไรให้ช่วยตัดสินใจจริง.
ออกแบบ telemetry, timestamps, data freshness, event log, dashboard และ alerts สำหรับ Smart Farm ให้เชื่อม Sensor, Irrigation, Pump/Valve, Flow/Pressure และอุปกรณ์ที่ offline ได้อย่างมีบริบท
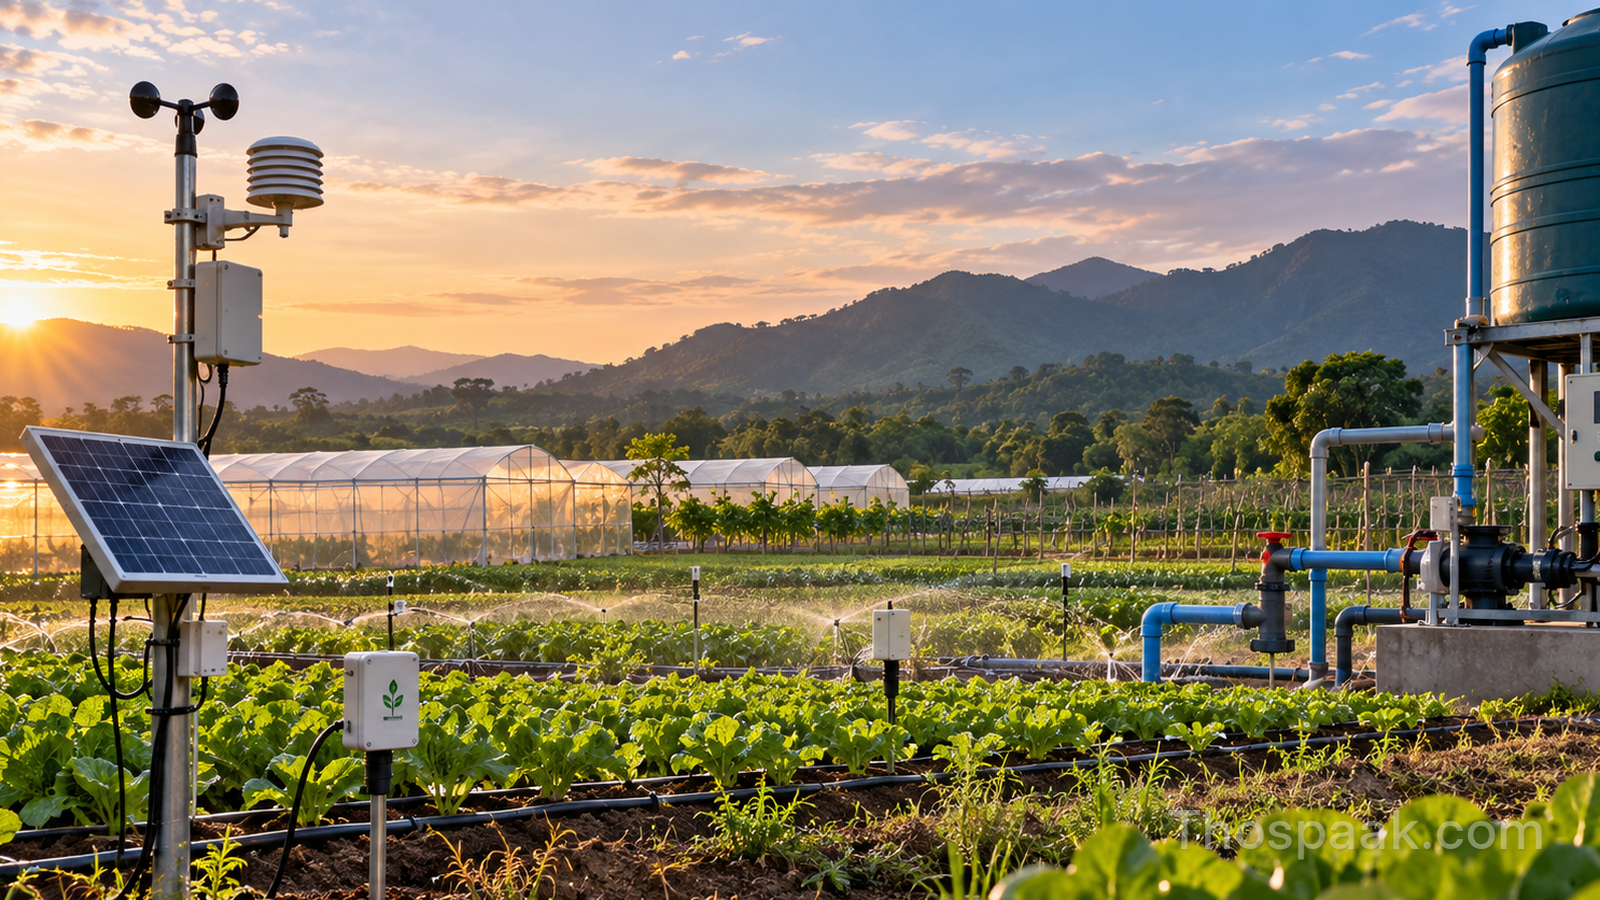
Smart Farm ที่เก็บทุก Sensor ทุกวินาทีแต่ไม่มี context อาจมีข้อมูลเยอะโดยตอบคำถามสำคัญไม่ได้
เป้าหมายของ logging/dashboard คือทำให้ตอบได้ว่า:
- ระบบกำลังทำอะไร
- ทำไมมันทำ
- ผลลัพธ์เกิดจริงหรือไม่
- อะไรผิดปกติ
- ข้อมูลไหน stale
Telemetry Record ขั้นต่ำ
ค่าที่สำคัญควรมีอย่างน้อย:
source/device
measurement
value + unit
timestamp
quality/status
zone/context
อย่าเก็บแค่ 31.4 โดยไม่รู้ว่าเป็นอะไรและอ่านเมื่อไร
Measurement Time vs Ingest Time
เมื่อ field network offline ข้อมูลอาจ upload ย้อนหลัง
ต้องแยก:
- เวลาที่ Sensor วัดจริง
- เวลาที่ Server ได้รับข้อมูล
ไม่เช่นนั้นกราฟจะวางข้อมูลย้อนหลังผิดเวลาและ Automation อาจคิดว่าค่าเก่าเป็นค่าปัจจุบัน
State/Event Log สำคัญไม่แพ้ Sensor Trend
ควร log event เช่น:
- irrigation requested
- valve opened/closed
- pump start/stop
- feedback confirmed
- mode changed Auto → Manual
- fault raised/cleared
- gateway disconnected/reconnected
ทำให้ debug ได้ว่า measurement เปลี่ยนเพราะ process หรือเพราะอุปกรณ์ผิดปกติ
Dashboard แบ่งตามคำถาม
Overview
- farm/site health
- active alarms
- current irrigation/pump state
- stale/offline nodes
- tank status
Zone View
- soil trend
- last irrigation
- flow/volume
- environment
- current mode
Water System
- tank
- pump
- pressure
- flow
- valves
- faults
อย่าโชว์ Gauge ทุกค่า
Gauge สวยแต่เทียบ trend ยาก ข้อมูลที่ต้องดูการเปลี่ยนแปลงตามเวลาเหมาะกับ time-series chart มากกว่า
ใช้ current-value card เฉพาะค่าที่ต้องรู้สถานะทันที
Data Freshness ต้องมองเห็นได้
UI ควรแยก:
- fresh
- delayed
- stale
- unavailable
ไม่ควรค้างค่าล่าสุดโดยไม่มี indicator จนคนคิดว่ายังสด
Alarm vs Notification
Alarm คือ state ที่ต้องจัดการ ส่วน Notification คือช่องทางบอกคน
อย่าผูกสองอย่างเป็นสิ่งเดียวกัน
ตัวอย่าง:
Alarm: Zone A no-flow
State: active until cleared/verified
Notification: LINE/email/push sent once + escalation policy
ถ้าส่ง notification ทุก sample จะกลายเป็น alert storm
Alert ต้องมี Context
ข้อความที่ดีควรบอก:
- site/zone
- condition
- actual value
- expected range
- duration
- operating state
- suggested next check เมื่อเหมาะสม
Severity
แบ่งง่าย ๆ เช่น:
- Info — state change
- Warning — inspect soon
- Critical — action/protection state active
อย่าทุกอย่างเป็น Critical
Retention และ Aggregation
ไม่จำเป็นต้องเก็บ raw cadence สูงตลอดชีวิต
อาจเก็บ:
- raw ช่วงสั้นตาม use case
- 5/15 นาที aggregate ระยะยาว
- daily totals
- event/fault log ระยะยาวกว่า
ต้องกำหนดตามการวิเคราะห์ที่จะใช้จริง
Dashboard ไม่ใช่ Control Authority โดยอัตโนมัติ
ปุ่มใน Dashboard เป็น command request ที่ต้องผ่าน ownership/permission และ feedback
UI click → Request → Command owner → Actuator → FeedbackOffline Data
Gateway ที่ buffer ข้อมูลควรส่งย้อนหลังโดยรักษา timestamp และ quality flag ดู Remote Field Connectivity
Metrics ที่ช่วย Optimize
เมื่อระบบนิ่งแล้วจึงค่อยใช้ข้อมูลหา:
- water volume per zone/day
- irrigation runtime vs soil response
- pump runtime/cycles
- no-flow frequency
- tank refill pattern
- sensor uptime/freshness
สิ่งเหล่านี้เปลี่ยน Smart Farm จาก remote control ไปสู่ resource optimization
Dashboard ที่ดีจึงไม่ใช่หน้าที่รวมกราฟเยอะที่สุด แต่เป็นหน้าที่ ทำให้ operator รู้ state, freshness, fault และผลของ automation ได้เร็วที่สุด